GAP
A "price gap" can be either of the following situations:
- When the Bid of a quote is more than the Ask of the previous quote
- When the Ask of a quote is less than the Bid of the previous quote
Please keep in mind that you can't always see a price gap on your chart. Let's take a look at two different scenarios to see how this works:
-
In this first scenario, you can see the price gap in the M1 (1-minute) time frame:
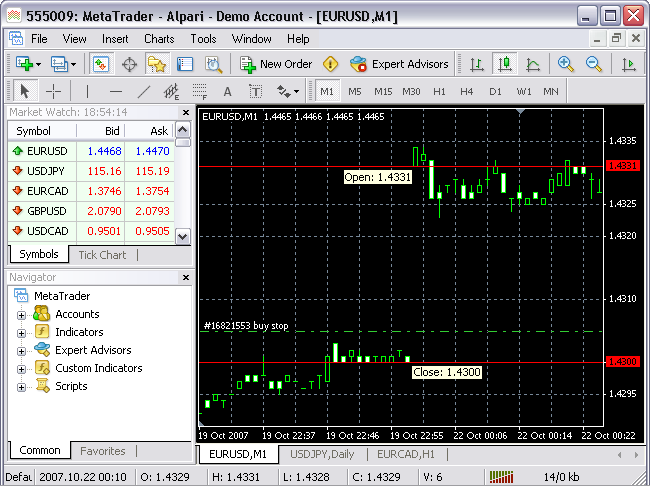
Here, a Buy Stop order was placed at 1.4305, as shown in the picture.
The last quote before the gap was 1.4300. The quote following the gap is 1.4331. The Buy Stop order, placed at 1.4305, falls into the price gap.
- In this second scenario, you can't see the price gap in the M1 (1-minute) time frame:
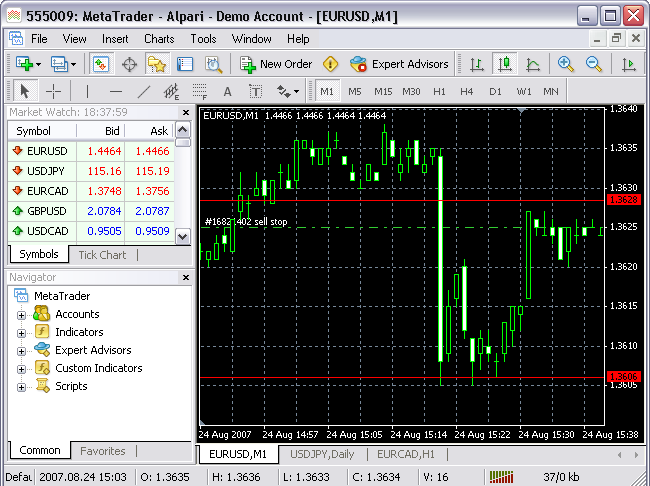
Here, a Sell Stop order was placed at 1.3625, as shown in the picture.
The last quote before the gap was 1.3628. The quote following the gap is 1.3606.
Here, the Sell Stop order at 1.3625 falls in the price gap.
You can see a long white candle in the chart. The price gap is enclosed in the candle. You can't see it in the chart.
Here, to see the price gap, go to myAlpari – "Trading Accounts" – "My Trading Accounts" – "Account Overview". Choose the "Tick History" tab and select a time period.
Latest analytical reviews
19 September, 13:20
18 September, 06:44
15 September, 10:00
There's a better website for you
A new exciting website with services that better suit your location has recently launched!
Sign up here to collect your 30% Welcome Bonus.